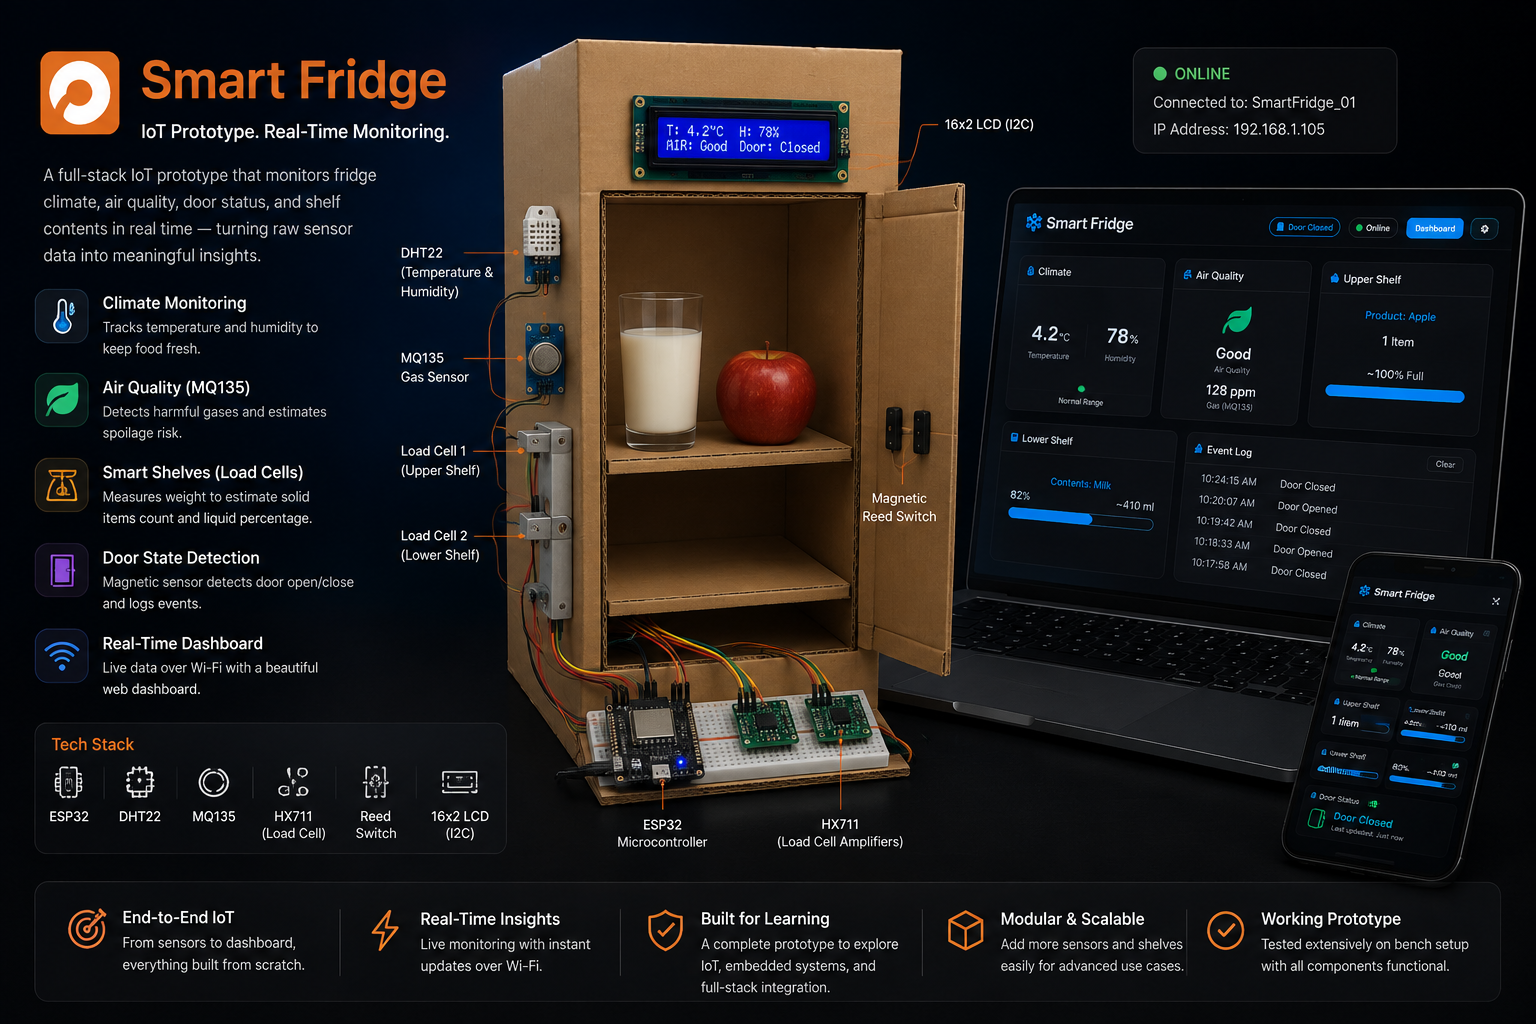
Project Overview
Knowing what's actually in a fridge, and whether it's still good, usually means opening the door and checking by hand. I built a full-stack IoT prototype that automates that: an ESP32 microcontroller reads temperature, humidity, gas, weight, and door-state sensors, and a real-time web dashboard turns that raw sensor data into a live view of climate conditions, spoilage risk, and estimated grocery stock. The project came out of curiosity about combining embedded hardware, an IoT data layer, and a polished front-end UI in one coherent system — the smart fridge concept was the vehicle for that, not a commercial brief.
At a Glance
- ▹Project goal: Build and demonstrate a complete embedded-to-web IoT pipeline, using a smart fridge as the use case
- ▹Target use case: Monitoring a fridge's climate, spoilage risk, and estimated grocery stock without opening the door
- ▹Core solution: An ESP32-based sensor layer feeding a local API, paired with a glassmorphism-styled dashboard that visualizes climate, spoilage risk, and stock levels in real time
- ▹Key outcome: A fully working hardware-and-software prototype, tested extensively on the bench setup, with every sensor-to-dashboard path functioning end to end
Project Context
A smart fridge is a genuinely interesting technical domain to build for a single project: it touches several different kinds of sensing (climate, gas, weight, contact) at once, requires turning physical signals into calibrated, meaningful values, and needs a live interface that stays readable while the underlying data keeps changing. That combination is why I chose it as the project to build, rather than starting from an identified market gap or client need.
Project Positioning
This is an independent proof-of-concept project, built solo to explore and demonstrate integrating embedded hardware with a real-time web dashboard. It's currently a working prototype on a breadboard and bench setup, not installed in an actual fridge.
The Challenge
What the Project Needed to Solve
- ▹Raw sensor readings — a temperature value, a gas concentration, a load cell number — don't mean anything to a person without context or thresholds
- ▹Solid item quantities aren't something a simple sensor can measure directly; weight has to be interpreted against known empty and full reference points per item
- ▹Liquid containers don't report a percentage remaining either — that has to be extrapolated from weight data and container-specific configuration
- ▹Gas-based spoilage indicators need a threshold-based interpretation, not just a raw ppm number, to actually be useful as an early warning
- ▹All of this data needs to reach a browser-based dashboard in real time, from a microcontroller with no dedicated backend server behind it
Why It Mattered
Sensor data on its own isn't useful information. Most of the actual engineering value in a project like this is in translating raw physical signals — a gas concentration, a load cell reading, a door switch state — into something clear enough that a person could trust it at a glance, which is where the calibration and interface design work had to go.
Project Goals
- ▹Read and interpret multiple sensor types — climate, gas, weight, and door state — on a single ESP32
- ▹Turn raw weight readings into a usable estimate of solid item quantity and liquid percentage remaining, configurable per item
- ▹Serve that data over a local network in real time, with no dedicated backend server beyond the ESP32 itself
- ▹Build a polished, real-time dashboard that makes the underlying sensor data genuinely readable, not just technically available
The Approach
1. Identifying What Data Actually Mattered
Before writing any dashboard code, the real design question was which raw values the ESP32 could reliably produce, and what someone would actually need to see instead of those raw values — a gas ppm reading versus a spoilage-risk indicator, or a load cell raw value versus "73% full."
2. Defining the Right Scope
Key scope decisions:
- ▹Kept the dashboard fully static, with no build environment: it runs by opening
index.htmldirectly, since the project's server-side logic already lives on the ESP32 itself - ▹Used a simple CORS-enabled REST endpoint on the ESP32 (
GET /api/data) instead of standing up a separate backend service, since the dashboard only needs to poll one small JSON payload - ▹Made weight thresholds configurable per item through the dashboard's own settings, rather than hardcoding calibration values into the firmware for every possible grocery item
3. Designing the Solution
Core solution components:
- ▹Climate tracking: a DHT22 sensor for temperature and humidity, with threshold alerts
- ▹Spoilage detection: an MQ135 gas sensor tracking ethylene and other breakdown gases as an early indicator
- ▹Smart shelving: two load cells with HX711 amplifiers, extrapolating both solid item counts and liquid percentage remaining in specific containers
- ▹Physical notifications: a magnetic reed switch for door-open logging, paired with red/yellow/green LEDs for at-a-glance physical status and a 16x2 I2C LCD for on-device readout
- ▹Dashboard: a glassmorphism-styled single-page web app with a live event log and a settings screen for calibrating individual items
4. Building and Validating
The firmware is written in C++ for the ESP32, using the Adafruit DHT sensor library, the HX711 Arduino library, and LiquidCrystal I2C for the on-device display. The ESP32 connects to Wi-Fi and serves live readings over a CORS-enabled local API, returning temperature, humidity, gas level, raw load cell values, and door state as JSON. The web dashboard — plain HTML, CSS, and JS with no build step — polls that endpoint and renders it through a glassmorphism UI built on CSS variables, floating elements, animated backgrounds, and gradient-based level trackers. The system was tested extensively on the bench hardware setup, covering the full path from physical sensor to live dashboard update.
5. Solving the Hardest Problem
Challenge: Turning raw load cell readings into something like "73% full"
Why it was difficult: A load cell only reports a raw weight value — it has no concept of what item sits on it, or what "empty" and "full" mean for that specific container. Two containers reporting the same raw weight could represent completely different fill levels depending on the item.
Decision made: Instead of hardcoding weight thresholds in firmware, I built a configurable system where each item's empty and full weights are set through the dashboard's own settings screen, and the ESP32's raw load cell output is extrapolated against those values to produce a usable percentage or item count.
Outcome: The same two physical load cells can support different items and containers over time, since the calibration lives in the config layer rather than being fixed at the firmware level.
The Solution
The finished prototype pairs a sensor-equipped ESP32 with a real-time web dashboard. The ESP32 reads temperature, humidity, gas concentration, two load cell channels, and door state, and serves them as JSON over a local, CORS-enabled endpoint. The dashboard polls that data and turns it into a live, visual read on climate, spoilage risk, and estimated grocery stock, with an event log and a settings screen for calibrating individual items.
Key Capabilities
- ▹Real-time climate tracking: temperature and humidity monitoring with threshold alerts
- ▹Spoilage detection: gas sensor tracking ethylene and other breakdown gases as an early warning signal
- ▹Configurable weight-based stock tracking: solid item counts and extrapolated liquid percentage levels, calibrated per item through the dashboard
- ▹Physical and digital notifications: door-open logging via a reed switch, paired with on-device LED status and an on-screen live event log
- ▹Local, dependency-light architecture: the ESP32 serves its own API with no separate backend, and the dashboard runs as a static site with no build step
Key Results
The prototype is fully built and has been tested extensively on its bench hardware setup, but hasn't been installed in a real fridge yet, so there's no real-world usage data. The results below reflect what's been built and validated on the bench.
Prototype and Technical Outcomes
- ▹Built a complete, working sensor-to-dashboard pipeline: every sensor type — climate, gas, weight, and door — is read by the ESP32 and correctly reflected on the live dashboard
- ▹Verified the end-to-end path from physical sensor input to real-time UI update through extensive testing on the bench hardware setup
- ▹Built a genuinely configurable stock-tracking system, with per-item empty/full weight calibration, rather than one hardcoded to a fixed set of grocery items
Technical Details
- ▹Architecture: ESP32 firmware in C++ serving a local, CORS-enabled REST API (
GET /api/data) with no dedicated backend server - ▹Sensor integration: DHT22 (climate), MQ135 (gas), dual HX711-amplified load cells (weight), and a magnetic reed switch (door state), all polled and reported through one unified API response
- ▹Frontend: a dependency-light static single-page app (HTML/CSS/JS, no build step) polling the ESP32's API and rendering it through a glassmorphism UI with CSS-variable-driven theming and animated, gradient-based level indicators
- ▹On-device feedback: a 16x2 I2C LCD display and red/yellow/green LEDs for status at the fridge itself, independent of the web dashboard
Qualitative Results
- ▹A fully functioning prototype, tested extensively on its bench hardware setup, covering climate, spoilage, weight, and door-state sensing in one system
- ▹A configurable weight-calibration system that can support different items and containers without firmware changes
- ▹A documented project, with separate hardware wiring and feature-logic references (
connections.md,features_and_functionality.md)
Impact
Building the full pipeline — from an analog load cell reading, through firmware-level interpretation, to a live web dashboard — end to end, on a single microcontroller with no external backend, shows that a genuinely useful smart-fridge concept doesn't need a complex server stack. Reasonable calibration and a lightweight local API are enough to turn a handful of physical sensors into a dashboard someone could actually read at a glance.
The next real step is moving from the current breadboard setup to an actual in-fridge install, where humidity and condensation, LED placement, and sensor durability inside a working fridge become part of the design problem rather than a bench-test simplification.
Hardware and Technology Stack
- ▹Microcontroller: ESP32
- ▹Sensors: DHT22 (temperature/humidity), MQ135 (gas/spoilage), 2x load cells with HX711 amplifiers (weight), magnetic reed switch (door state)
- ▹On-device output: 16x2 I2C LCD, red/yellow/green LEDs
- ▹Firmware: C++ (Arduino framework), Adafruit DHT sensor library, HX711 Arduino library, LiquidCrystal I2C
- ▹Networking: local Wi-Fi-based REST API on the ESP32, CORS-enabled, JSON responses
- ▹Frontend: static HTML/CSS/JS single-page dashboard, no build tooling, CSS variables for theming
Skills Demonstrated
- ▹Embedded systems programming (C++/Arduino) across multiple sensor types
- ▹Analog sensor calibration and signal interpretation, including load cell weight-to-quantity extrapolation
- ▹Local REST API design and implementation directly on a microcontroller
- ▹Real-time front-end development, polling and rendering live device data
- ▹End-to-end hardware-to-software system design, from wiring through UI
My Role and Contribution
I built the entire system solo, end to end, from the hardware layer through the dashboard.
I was responsible for:
- ▹Selecting and wiring all hardware components — the ESP32, sensors, LEDs, LCD, and load cells
- ▹Writing the ESP32 firmware in C++, including sensor reading, calibration logic, and the local REST API
- ▹Designing and building the web dashboard, including the glassmorphism UI, live event log, and per-item settings system
- ▹Testing and validating the full sensor-to-dashboard pipeline on the bench hardware setup
- ▹Documenting the hardware wiring and feature logic
Team setup: Solo developer.
Lessons and Reflection
- ▹What worked well: Keeping calibration — empty and full weight per item — in the dashboard's config layer instead of hardcoded in firmware meant the same physical load cells could support different items without re-flashing the ESP32.
- ▹What I would improve: This has only been tested on a bench setup so far. Installing it in an actual fridge next would show how humidity, condensation, and real grocery items affect sensor readings compared to a controlled bench environment.
- ▹What the project taught me: Most of the real difficulty in a project like this isn't reading a sensor — it's turning a raw sensor value into something a person can actually trust and act on, which is where the calibration and UI design work matters most.
Closing Summary
This project turns a handful of physical sensors — climate, gas, weight, and door state — into a live, readable dashboard, using an ESP32 as the entire backend and a lightweight static web app as the front end. Built solo, out of curiosity about combining embedded hardware with a real-time UI, the system is a fully working prototype, tested extensively on its bench hardware setup, with a configurable weight-calibration system ready to support real grocery items once it moves off the breadboard and into an actual fridge.
Project takeaway: Built a complete, working IoT pipeline solo — from raw sensor data to a real-time dashboard — proving out the hardest part, turning physical signals into trustworthy, readable information, before ever installing it in a real fridge.
Optional Visuals
This project would benefit from a few visuals once available: a photo of the bench/breadboard hardware setup with components labeled, a screenshot of the live dashboard showing the glassmorphism UI and level trackers, and a short clip or GIF of a sensor change (e.g. opening the door or adjusting weight) updating the dashboard in real time.